It’s been a long time coming but a nice alternative to using goals to track sales trends and performance has finally arrived for the Microsoft Dynamics 365 community. For those poor souls that ever had to experience the clunky, non-intuitive setting up of goals in Dynamics 365, you’ll understand the elation that this news brings to sales managers and Dynamics 365 admins everywhere.
Track sales performance in Dynamics 365
With Sales Forecasting in Microsoft Dynamics 365, it’s now possible to create a pivot table style view of your opportunities right inside of Dynamics. Essentially, the way it works is to pivot the values from an option set (lookup list) called Forecast Category that sits on each opportunity. The out of the box list contains the values below, but you can use your own if you prefer.
- Pipeline – this represents early stages.
- Best case – moderate confidence of winning.
- Committed- high confidence of winning.
- Omitted- removed from pipeline for now.
- Won – Automatically set when you win an opportunity
- Lost -Automatically set when you lose an opportunity
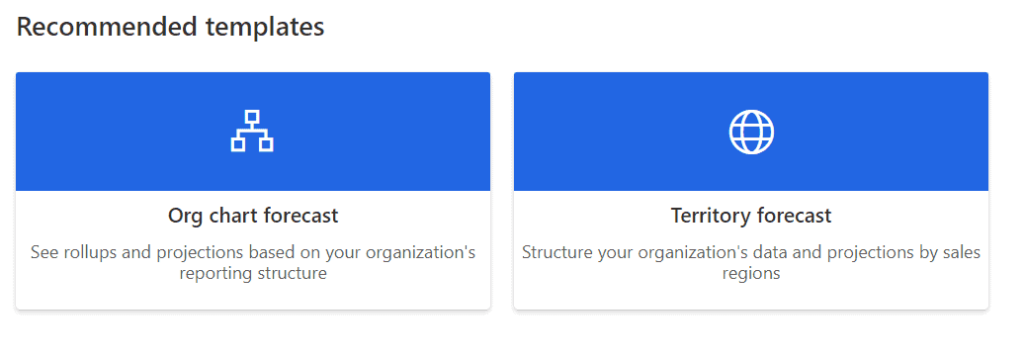
Currently, in the first release, there are a few limitations around the setting up of forecasts, in that there are only two methods (user or territory). Although we see this becoming more flexible with future releases.
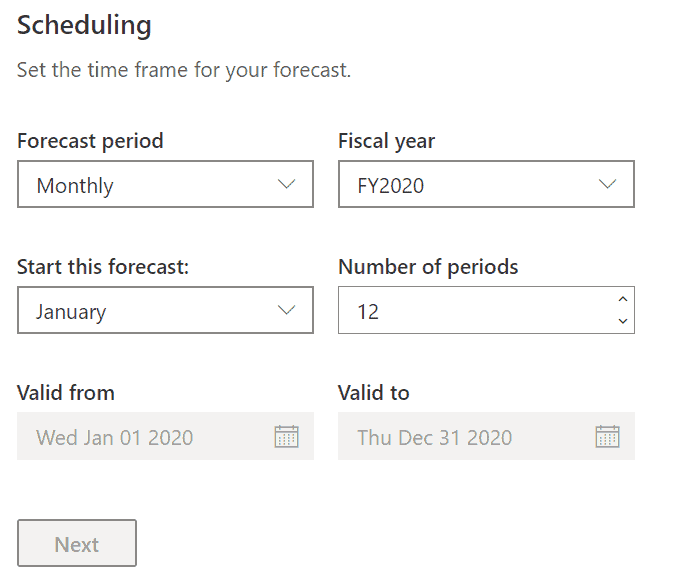
 The reporting periods are also pretty rigid, either a max of 12 months or 4 quarters, (but this is already so much better than Goals!).
We found that by using additional filters we could workaround these issues for one of our early adopter clients for whom the out of the box approach didn’t work.
There is a fairly simple stepped process to creating forecasts. After which you can download an Excel template for the quotas which can be populated and then uploaded again.
Three things we love about the new forecasting features:
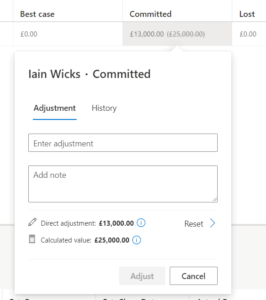
1. You can edit the opportunities and the forecast amounts directly inside the views.

2. The kanban view: You can now literally drag an opportunity from one stage to another.

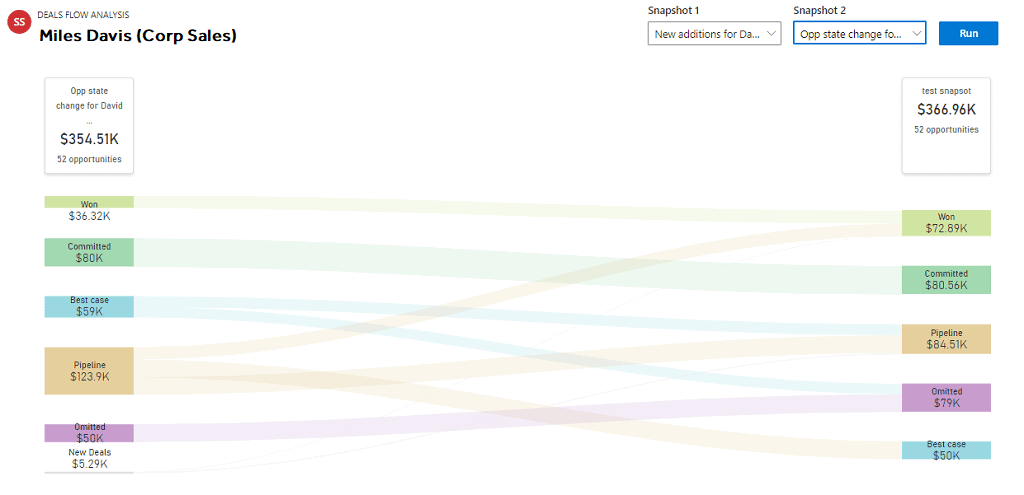
3. Snapshots that allow you to compare two points in time.
This feature first appeared in preview about a year ago. At the time we felt it wasn’t really ready for prime time (see the original post). Now, a few months later, we are giving the official Rocket CRM nod of approval to our customers to go ahead and start forecasting. We predict that customers will love this new feature and that Microsoft will, undoubtedly, improve its functionality over a period of time.
If you want to try it out for yourself, here is a link to the Microsoft Docs page with more info on how to set it up.
https://docs.microsoft.com/en-us/dynamics365/sales-enterprise/view-forecasts
Are you looking for a better CRM?
Are you experiencing a lack of clarity around your sales efforts right now?
Would you like to be able to predict what’s coming in over the next few months so you can plan better for the future?
We help companies gain a clearer picture of their prospects and sales opportunities by switching to Microsoft Dynamics 365.
Get in touch to ask us how.


